
Medium
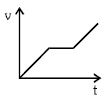
The acceleration-time graph for a body is shown in the graph. Which of the following graphs would probably represent the velocity of the body plotted against time?
- A
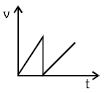
- B
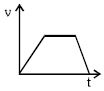
- C
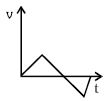
- D
Explore More
Similar Questions
What is the maximum acceleration of the train during the journey in $km \ h^{-2}$?
Difficult
View SolutionMatch Column-$I$ with Column-$II$ based on the distance-time $(d-t)$ graphs provided in the image.
$(1)$ Velocity decreases $(a)$ Linear graph (constant slope) $(2)$ Velocity increases $(b)$ Concave up graph (increasing slope) $(3)$ Velocity is constant $(c)$ Concave down graph (decreasing slope)
| $(1)$ Velocity decreases | $(a)$ Linear graph (constant slope) |
| $(2)$ Velocity increases | $(b)$ Concave up graph (increasing slope) |
| $(3)$ Velocity is constant | $(c)$ Concave down graph (decreasing slope) |
Easy
View SolutionThe displacement-time graph for two particles $A$ and $B$ is as follows. The ratio $\frac{v_A}{v_B}$ is
Medium
View SolutionExplain instantaneous velocity.
Easy
View SolutionThe instantaneous velocity of a body can be measured by:
Easy
View SolutionVedclass Products
For Students
Vedclass Test Series
Mock tests in real JEE/NEET style with performance analysis. 5-day free trial.
Start Free TrialFor Teachers
Exam Paper Generator
Generate Set A/B/C/D exam papers from 7.5L+ questions in 2 minutes. 3 chapters free.
Try FreeFor Institutes
Online Exam Module
Live online exams with unlimited students, 360° analytics & white-label branding.
See Demo