
Medium
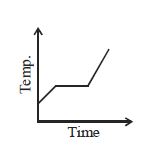
Liquid oxygen at $50\ K$ is heated to $300\ K$ at a constant pressure of $1\ atm$. The rate of heating is constant. Which of the following graphs represents the variation of temperature with time?
- A
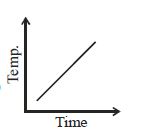
- B
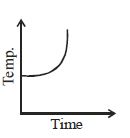
- C
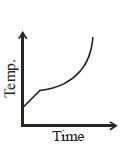
- D
Explore More
Similar Questions
$A$ solid material is supplied with heat at a constant rate. The temperature of the material changes with heat input as shown in the figure. What does the slope of $DE$ represent?
Medium
View SolutionLiquid oxygen at $50\ K$ is heated to $300\ K$ at a constant pressure of $1\ atm$. The rate of heating is constant. Which of the following graphs represents the variation of temperature with time?
Medium
View SolutionExplain the process of melting of ice with an explanation of freezing,melting,and melting point.
Medium
View SolutionTwo substances $A$ and $B$ of equal mass are heated at a constant rate of $6 \ cal \ s^{-1}$. The graph shows the temperature versus time. What is the ratio of the heat absorbed for complete melting $H_A/H_B$?
Difficult
View SolutionMatch the following according to conversion by heat:
Column-$I$ Column-$II$ $(a)$ Required heat to convert solid into gaseous. $(i)$ Latent heat of fusion $(b)$ Required heat to convert solid into liquid. $(ii)$ Latent heat of vaporization
| Column-$I$ | Column-$II$ |
|---|---|
| $(a)$ Required heat to convert solid into gaseous. | $(i)$ Latent heat of fusion |
| $(b)$ Required heat to convert solid into liquid. | $(ii)$ Latent heat of vaporization |
Easy
View SolutionVedclass Products
For Students
Vedclass Test Series
Mock tests in real JEE/NEET style with performance analysis. 5-day free trial.
Start Free TrialFor Teachers
Exam Paper Generator
Generate Set A/B/C/D exam papers from 7.5L+ questions in 2 minutes. 3 chapters free.
Try FreeFor Institutes
Online Exam Module
Live online exams with unlimited students, 360° analytics & white-label branding.
See Demo