
Medium
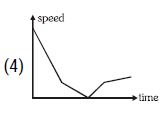
In the picture shown,a ball starting from rest rolls down a ramp $AB$,moves along the horizontal bottom $BC$,then goes up a smaller ramp $CD$,and thereafter rolls on the horizontal plane $DE$. Ignore friction and air resistance. Which of the following figures shows the variation in speed with time?
- A
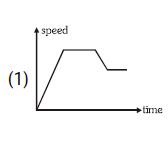
- B
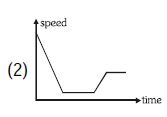
- C
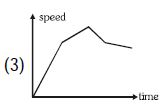
- D
Explore More
Similar Questions
The velocity-time $(v-t)$ graph for a moving object is shown in the figure. The total displacement of the object during the time interval when there is non-zero acceleration and retardation is ........ $m$.
Medium
View SolutionExplain instantaneous velocity and discuss how it can be determined from an $x-t$ graph.
Difficult
View SolutionThe distance covered by the particle in the last $2\,s$ is what fraction of the total distance covered by it in $7\,s$?
Difficult
View SolutionDraw the $x-t$ graph for an object moving with zero acceleration.
Easy
View SolutionThe velocity-time graph for two bodies $A$ and $B$ is shown. Then the acceleration of $A$ and $B$ are in the ratio:
Vedclass Products
For Students
Vedclass Test Series
Mock tests in real JEE/NEET style with performance analysis. 5-day free trial.
Start Free TrialFor Teachers
Exam Paper Generator
Generate Set A/B/C/D exam papers from 7.5L+ questions in 2 minutes. 3 chapters free.
Try FreeFor Institutes
Online Exam Module
Live online exams with unlimited students, 360° analytics & white-label branding.
See Demo