
An ideal gas undergoes a thermodynamic cycle as shown in the figure. Which of the following graphs represents the same cycle?
- A
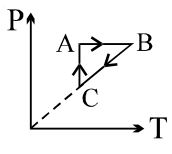
- B
- C
- D
Explore More
Similar Questions
The following graph shows two isotherms for a fixed mass of an ideal gas. The ratio of $r.m.s.$ speed of the molecules at temperatures $T_1$ and $T_2$ is
What is the primary purpose of data entry in the context of mathematical research?
In land plants,the guard cells differ from other epidermal cells in having:
Which one of the following represents the graph between $\log p$ (on $Y$-axis) and $\frac{1}{T}$ (on $X$-axis)?
($p=$ vapour pressure of a liquid,$T=$ absolute temperature)
($p=$ vapour pressure of a liquid,$T=$ absolute temperature)
If the tangents at the extremities of a chord $PQ$ of a parabola intersect at $T$,then the distances of the focus of the parabola from the points $P, T, Q$ are in-
Vedclass Products
For Students
Vedclass Test Series
Mock tests in real JEE/NEET style with performance analysis. 5-day free trial.
Start Free TrialFor Teachers
Exam Paper Generator
Generate Set A/B/C/D exam papers from 7.5L+ questions in 2 minutes. 3 chapters free.
Try FreeFor Institutes
Online Exam Module
Live online exams with unlimited students, 360° analytics & white-label branding.
See Demo