
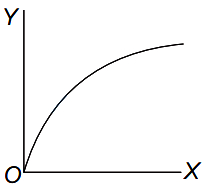
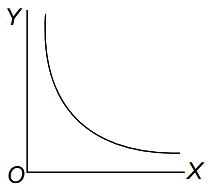
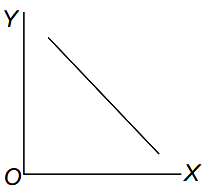
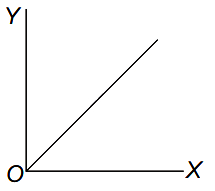
Which one of the following represents the graph between $\log p$ (on $Y$-axis) and $\frac{1}{T}$ (on $X$-axis)?
($p=$ vapour pressure of a liquid,$T=$ absolute temperature)
($p=$ vapour pressure of a liquid,$T=$ absolute temperature)
- A
- B
- C
- D
Explore More
Similar Questions
Choose the correct alternative answer
$a...be....a....beda.....ccd....bed.$
Choose the correct alternative answer
$a...be....a....beda.....ccd....bed.$
If the lines $4x + 3y - 1 = 0$,$x - y + 5 = 0$,and $kx + 5y - 3 = 0$ are concurrent,then $k$ is equal to:
Which of the following substances would quickly absorb oxygen?
If $(p \wedge \sim q) \wedge (p \wedge r) \to \sim p \vee q$ is false,then the truth values of $p, q$ and $r$ are respectively
$A$ $200\, W$ sodium street lamp emits yellow light of wavelength $0.6\, \mu m$. Assuming it to be $50\%$ efficient in converting electrical energy to light,the number of photons of yellow light it emits per second is:
Vedclass Products
For Students
Vedclass Test Series
Mock tests in real JEE/NEET style with performance analysis. 5-day free trial.
Start Free TrialFor Teachers
Exam Paper Generator
Generate Set A/B/C/D exam papers from 7.5L+ questions in 2 minutes. 3 chapters free.
Try FreeFor Institutes
Online Exam Module
Live online exams with unlimited students, 360° analytics & white-label branding.
See Demo