
Medium
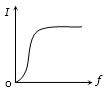
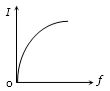
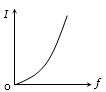
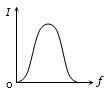
An $ac$ source of variable frequency $f$ is connected to an $LCR$ series circuit. Which one of the graphs represents the variation of current $I$ in the circuit with frequency $f$?
- A
- B
- C
- D
Explore More
Similar Questions
For better tuning of a series $LCR$ circuit in a communication system,the preferred combination is
The resonant frequency of a series $LCR$ circuit is $f_R$. The circuit is connected to a sinusoidally alternating e.m.f. of frequency $2 f_R$. The inductive reactance becomes $X_{L_1}$ and capacitive reactance becomes $X_{C_1}$ after changing the frequency. $X_{C_1}$ is equal to:
The output voltage (taken across the resistance) of an $L-C-R$ series resonant circuit falls to half its peak value at a frequency of $200 \,Hz$ and again reaches the same value at $800 \,Hz$. The bandwidth of this circuit is ............. $\,Hz$.
In a series $LCR$ resonant circuit,the quality factor is measured as $100$. If the inductance is increased by two fold and resistance is decreased by two fold,then the quality factor after this change will be .........
DifficultJEE MAIN 2021
View SolutionObtain the resonant frequency $\omega_{r}$ of a series $LCR$ circuit with $L=2.0 \;H, C=32\; \mu F$ and $R=10\; \Omega$. What is the $Q$-value of this circuit?
Medium
View SolutionVedclass Products
For Students
Vedclass Test Series
Mock tests in real JEE/NEET style with performance analysis. 5-day free trial.
Start Free TrialFor Teachers
Exam Paper Generator
Generate Set A/B/C/D exam papers from 7.5L+ questions in 2 minutes. 3 chapters free.
Try FreeFor Institutes
Online Exam Module
Live online exams with unlimited students, 360° analytics & white-label branding.
See Demo