
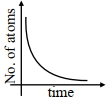
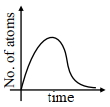
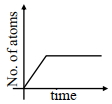
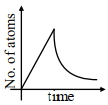
$A$ sample of a radioactive nucleus $A$ disintegrates to another radioactive nucleus $B$,which in turn disintegrates to some other stable nucleus $C$. Plot a graph showing the variation of the number of atoms of nucleus $B$ versus time:
(Assume that at $t=0$,there are no $B$ atoms in the sample)
(Assume that at $t=0$,there are no $B$ atoms in the sample)
- A
- B
- C
- D
Explore More
Similar Questions
In a radioactive decay chain,${ }_{90}^{232} Th$ nucleus decays to ${ }_{82}^{212} Pb$ nucleus. Let $N_{\alpha}$ and $N_{\beta}$ be the number of $\alpha$ and $\beta^{-}$ particles,respectively,emitted in this decay process. Which of the following statements is (are) true?
$(A)$ $N_{\alpha}=5$
$(B)$ $N_{\alpha}=6$
$(C)$ $N_{\beta}=2$
$(D)$ $N_{\beta}=4$
$(A)$ $N_{\alpha}=5$
$(B)$ $N_{\alpha}=6$
$(C)$ $N_{\beta}=2$
$(D)$ $N_{\beta}=4$
MediumIIT 2018
View SolutionIn the following nuclear reaction,$x$ stands for: $n \rightarrow p + e^{-} + x$
$A$ positron is emitted from ${}^{23}Na_{11}$. The ratio of the atomic mass and atomic number of the resulting nuclide is
DifficultIIT 2007
View SolutionAssertion: Radioactive nuclei emit $\beta^-$ particles.
Reason: Electrons exist inside the nucleus.
Reason: Electrons exist inside the nucleus.
$1$ curie represents
Vedclass Products
For Students
Vedclass Test Series
Mock tests in real JEE/NEET style with performance analysis. 5-day free trial.
Start Free TrialFor Teachers
Exam Paper Generator
Generate Set A/B/C/D exam papers from 7.5L+ questions in 2 minutes. 3 chapters free.
Try FreeFor Institutes
Online Exam Module
Live online exams with unlimited students, 360° analytics & white-label branding.
See Demo