
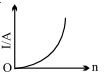
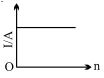
$A$ battery consists of a variable number $n$ of identical cells,each having electromotive force $E$ and internal resistance $r$,connected in series. The terminals of the battery are short-circuited,and the current $I$ is measured. Which one of the graphs below shows the relationship between $I$ and $n$?
- A

- B

- C
- D
Explore More
Similar Questions
$A$ cell having an emf $\varepsilon$ and internal resistance $r$ is connected across a variable external resistance $R$. As the resistance $R$ is increased,the plot of potential difference $V$ across $R$ is given by:
MediumAIPMT 2012
View SolutionThe thermo emf of a hypothetical thermocouple varies with the temperature $\theta$ of the hot junction as $E = a\theta + b\theta^2$ in volts,where the ratio $a/b$ is $700^{\circ}C$. If the cold junction is kept at $0^{\circ}C$,then the neutral temperature is:
$A$ cell of emf $\varepsilon$ and internal resistance $r$ is connected across a variable load resistance $R$. The graph drawn between its terminal voltage $V$ and resistance $R$ is
In a copper voltameter,the mass of copper deposited in $6 \, \text{min}$ is $m \, \text{g}$. If the current-time graph is as shown in the figure,the electrochemical equivalent of copper will be:
Difficult
View SolutionTotal $emf$ produced in a thermocouple does not depend on
Vedclass Products
For Students
Vedclass Test Series
Mock tests in real JEE/NEET style with performance analysis. 5-day free trial.
Start Free TrialFor Teachers
Exam Paper Generator
Generate Set A/B/C/D exam papers from 7.5L+ questions in 2 minutes. 3 chapters free.
Try FreeFor Institutes
Online Exam Module
Live online exams with unlimited students, 360° analytics & white-label branding.
See Demo