
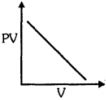
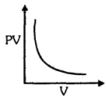
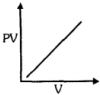
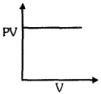
Which graph represents the variation of $PV$ with $V$ for a fixed mass of an ideal gas at constant temperature?
- A
- B
- C
- D
Explore More
Similar Questions
Two thermally insulated vessels $1$ and $2$ contain air at temperatures $(T_1, T_2)$,volumes $(V_1, V_2)$,and pressures $(P_1, P_2)$. If the valve connecting them is opened,what will be the equilibrium temperature of the system?
Difficult
View SolutionIf a closed container containing gas is in motion and is suddenly stopped,the random motion of the gas molecules will .......
Easy
View SolutionAccording to the kinetic theory of gases,when two molecules of a gas collide with each other,then:
Fill in the blanks:
$(i)$ At absolute zero,the volume of an ideal gas is ...... .
$(ii)$ With an increase in temperature,the pressure of a gas ...... .
$(iii)$ All molecular motion will stop at ...... .
$(iv)$ Due to ...... at higher altitudes from the surface of the Earth,the air becomes cooler.
$(i)$ At absolute zero,the volume of an ideal gas is ...... .
$(ii)$ With an increase in temperature,the pressure of a gas ...... .
$(iii)$ All molecular motion will stop at ...... .
$(iv)$ Due to ...... at higher altitudes from the surface of the Earth,the air becomes cooler.
Medium
View SolutionOne mole of an ideal gas at standard temperature and pressure occupies $22.4 \; L$ (molar volume). What is the ratio of molar volume to the atomic volume of a mole of hydrogen? (Take the size of a hydrogen molecule to be about $1 \; \mathring{A}$). Why is this ratio so large?
Medium
View SolutionVedclass Products
For Students
Vedclass Test Series
Mock tests in real JEE/NEET style with performance analysis. 5-day free trial.
Start Free TrialFor Teachers
Exam Paper Generator
Generate Set A/B/C/D exam papers from 7.5L+ questions in 2 minutes. 3 chapters free.
Try FreeFor Institutes
Online Exam Module
Live online exams with unlimited students, 360° analytics & white-label branding.
See Demo