
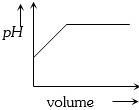
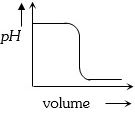
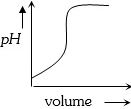
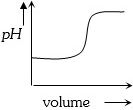
Which of the following plots represents the graph of $pH$ against the volume of alkali added in the titration of $NaOH$ and $HCl$?
- A
- B
- C
- D
Explore More
Similar Questions
Which one of the following statements is not true?
MediumAIEEE 2003
View SolutionArrange the following solutions in the decreasing order of $pOH$:
$A$. $0.01 \ M \ HCl$
$B$. $0.01 \ M \ NaOH$
$C$. $0.01 \ M \ CH_3COONa$
$D$. $0.01 \ M \ NaCl$
$A$. $0.01 \ M \ HCl$
$B$. $0.01 \ M \ NaOH$
$C$. $0.01 \ M \ CH_3COONa$
$D$. $0.01 \ M \ NaCl$
Which of the following statements are incorrect?
MediumWBJEE 2022
View SolutionIn a saturated solution of $Mg(OH)_2$,the degree of dissociation of $Mg(OH)_2$ is $\alpha$. Find the concentration $(C)$ of $Mg(OH)_2$ if the concentration of $[OH^{-}]$ is $2$.
Medium
View SolutionStatement $A$: $pH$ of a buffer increases with increasing temperature. Statement $B$: The value of $K_W$ of water decreases with decreasing temperature.
Vedclass Products
For Students
Vedclass Test Series
Mock tests in real JEE/NEET style with performance analysis. 5-day free trial.
Start Free TrialFor Teachers
Exam Paper Generator
Generate Set A/B/C/D exam papers from 7.5L+ questions in 2 minutes. 3 chapters free.
Try FreeFor Institutes
Online Exam Module
Live online exams with unlimited students, 360° analytics & white-label branding.
See Demo