
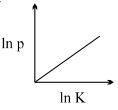
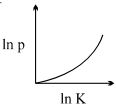
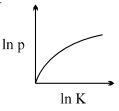
Which of the following graphs represents the graphical relation between momentum $(p)$ and kinetic energy $(K)$ for a body in motion?
- A
- B
- C
- DNone of these.
Explore More
Similar Questions
$A$ bullet of mass $50 \ g$ is fired with a speed $100 \ m/s$ on a plywood and emerges with $40 \ m/s$. The percentage loss of kinetic energy is:
The graph between kinetic energy $E$ and velocity $v$ is:
Easy
View SolutionIn a ballistics demonstration,a police officer fires a bullet of mass $50.0 \; g$ with a speed of $200 \; m s^{-1}$ into soft plywood of thickness $2.00 \; cm$. The bullet emerges with only $10 \%$ of its initial kinetic energy. What is the emergent speed of the bullet?
Easy
View SolutionIf the force acting on a body is inversely proportional to its speed,then its kinetic energy is
Medium
View SolutionIf the linear momentum is increased by $5\%$,the kinetic energy will increase by.......$\%$
Vedclass Products
For Students
Vedclass Test Series
Mock tests in real JEE/NEET style with performance analysis. 5-day free trial.
Start Free TrialFor Teachers
Exam Paper Generator
Generate Set A/B/C/D exam papers from 7.5L+ questions in 2 minutes. 3 chapters free.
Try FreeFor Institutes
Online Exam Module
Live online exams with unlimited students, 360° analytics & white-label branding.
See Demo