
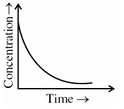
Which of the following graphs is incorrect for a first-order reaction? $A \rightarrow B$
- A
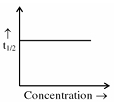
- B
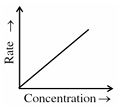
- C
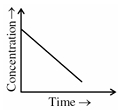
- D
Explore More
Similar Questions
Which of the following statements is correct?
Medium
View SolutionThe temperature coefficient of most of the reactions lies between
Easy
View SolutionThe given graph is a representation of kinetics of a reaction. The $y$ and $x$ axes for zero and first order reactions,respectively are
MediumNEET 2022
View SolutionAt $100\,^\circ C,$ the gaseous reaction $A_{(g)} \rightarrow 2B_{(g)} + C_{(g)}$ is found to be first order. Starting with pure $A,$ if at the end of $10\,\min$,the total pressure of the system is $160\,mm$ and after a long time,when dissociation of $A$ was complete,it was $300\,mm.$ The partial pressure of $A$ at the end of $10\,\min$ is .......... $mm$
Medium
View SolutionHalf-lives of a first-order and a zero-order reaction are the same. Assume that the initial concentration of the reactant is the same for both reactions,then the ratio of the initial rates of the first-order reaction to that of the zero-order reaction is:
Medium
View SolutionVedclass Products
For Students
Vedclass Test Series
Mock tests in real JEE/NEET style with performance analysis. 5-day free trial.
Start Free TrialFor Teachers
Exam Paper Generator
Generate Set A/B/C/D exam papers from 7.5L+ questions in 2 minutes. 3 chapters free.
Try FreeFor Institutes
Online Exam Module
Live online exams with unlimited students, 360° analytics & white-label branding.
See Demo