
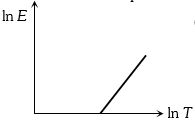
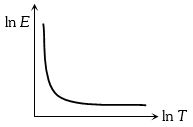
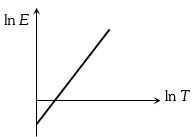
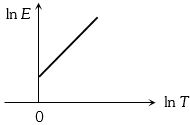
Which of the following graphs correctly represents the relation between $\ln E$ and $\ln T$, where $E$ is the amount of radiation emitted per unit time from unit area of a body and $T$ is the absolute temperature?
- A
- B
- C
- D
Explore More
Similar Questions
$A$ black body radiates at the rate of $W$ watts at a temperature $T$. If the temperature of the body is reduced to $T/3$,it will radiate at the rate of (in Watts):
Medium
View Solution$A$ black body radiates maximum energy at wavelength $\lambda$ and its emissive power is $E$. Now,due to a change in temperature of that body,it radiates maximum energy at wavelength $\frac{\lambda}{3}$. At that new temperature,the emissive power is: (in $E$)
If a substance at temperature $T$ is kept in surroundings at temperature $T_S$,what is the net rate of loss of radiation energy?
Easy
View SolutionThe temperature of a black body increases from $327^{\circ}C$ to $927^{\circ}C$. If the initial energy possessed is $2 \ kJ$,what is its final energy in $kJ$?
Medium
View Solution$A$ black rectangular surface of area '$A$' emits energy '$E$' per second at $27^{\circ}C$. If length and breadth are reduced to $(1/3)^{rd}$ of their initial values and temperature is raised to $327^{\circ}C$,then the energy emitted per second becomes:
Vedclass Products
For Students
Vedclass Test Series
Mock tests in real JEE/NEET style with performance analysis. 5-day free trial.
Start Free TrialFor Teachers
Exam Paper Generator
Generate Set A/B/C/D exam papers from 7.5L+ questions in 2 minutes. 3 chapters free.
Try FreeFor Institutes
Online Exam Module
Live online exams with unlimited students, 360° analytics & white-label branding.
See Demo