
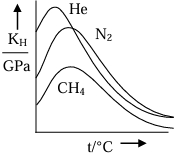
Which of the following graphs correctly represents the plots of $K_{H}$ for gases in water versus temperature?
- A
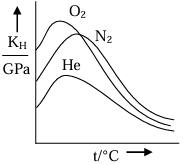
- B
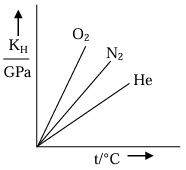
- C
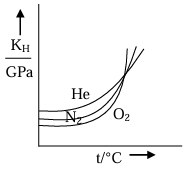
- D
Explore More
Similar Questions
Which among the following salts shows a decrease in solubility with an increase in temperature?
At $298 \ K$,the mole percentage of $N_{2(g)}$ in air is $80\%$. Water is in equilibrium with air at a pressure of $10 \ atm$. What is the mole fraction of $N_{2(g)}$ in water at $298 \ K$? ($K_H$ for $N_2$ is $6.5 \times 10^7 \ mm \ Hg$)
DifficultJEE MAIN 2026
View SolutionIn which solution,the solubility of the solute decreases with an increase in temperature?
The oxygen dissolved in water exerts a partial pressure of $20 \ kPa$ in the vapour above water. The molar solubility of oxygen in water is ............ $\times 10^{-5} \ mol \ dm^{-3}$ (Round off to the Nearest Integer). [Given: Henry's law constant $K_H = 8.0 \times 10^{4} \ kPa$ for $O_2$,Density of water $= 1.0 \ kg \ dm^{-3}$]
What is solubility? Explain the solubility of a solid solute in a liquid solvent.
Vedclass Products
For Students
Vedclass Test Series
Mock tests in real JEE/NEET style with performance analysis. 5-day free trial.
Start Free TrialFor Teachers
Exam Paper Generator
Generate Set A/B/C/D exam papers from 7.5L+ questions in 2 minutes. 3 chapters free.
Try FreeFor Institutes
Online Exam Module
Live online exams with unlimited students, 360° analytics & white-label branding.
See Demo