
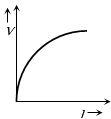
Which of the following graphs represents an ohmic resistance?
- A
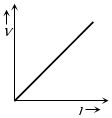
- B
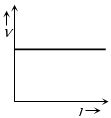
- C
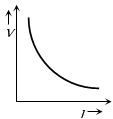
- D
Explore More
Similar Questions
The $V-I$ graph for a conductor at temperatures $T_1$ and $T_2$ is as shown in the figure. $T_2-T_1$ is proportional to
For a metallic wire,the ratio $V/i$ ($V =$ the applied potential difference,$i =$ current flowing) is
Easy
View SolutionWhich of the following graphs represents an ohmic resistor?
Easy
View SolutionThe $V-I$ graph for a conductor at two different temperatures $T_1$ and $T_2$ is shown. The relationship between $T_1$ and $T_2$ is:
Easy
View SolutionThe $V-I$ graphs $A$ and $B$ are drawn for two voltameters. Identify each graph.
Medium
View SolutionVedclass Products
For Students
Vedclass Test Series
Mock tests in real JEE/NEET style with performance analysis. 5-day free trial.
Start Free TrialFor Teachers
Exam Paper Generator
Generate Set A/B/C/D exam papers from 7.5L+ questions in 2 minutes. 3 chapters free.
Try FreeFor Institutes
Online Exam Module
Live online exams with unlimited students, 360° analytics & white-label branding.
See Demo