
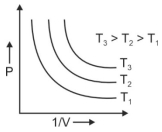
Which amongst the following options is the correct graphical representation of Boyle's law?
- A
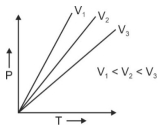
- B
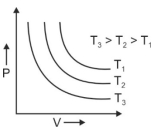
- C
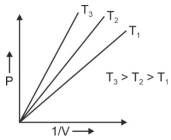
- D
Explore More
Similar Questions
An ideal gas with a molar mass of $40 \ g \ mol^{-1}$ has a mass of $120 \ g$. It occupies a volume of $20 \ L$ at a temperature of $400 \ K$. Using $R = 0.0821 \ L \ atm \ K^{-1} \ mol^{-1}$,the pressure of the gas is ........ $atm$.
Medium
View SolutionFor an ideal gas,if $P$ is the pressure,$R$ is the gas constant,and $T$ is the temperature,which of the following represents the number of moles per liter?
Easy
View SolutionWhat is the molar volume of an ideal gas at $STP$ (or $NTP$) and $SATP$?
Medium
View SolutionAt $25^{\circ} C$ and $760 \,mm \,Hg$ pressure,a gas occupies $600 \,mL$ volume. What will be its pressure at a height where the temperature is $10^{\circ} C$ and the volume of the gas is $640 \,mL$?
Easy
View SolutionThe variation of volume of an ideal gas with its number of moles $(n)$ is obtained as a graph at $300 \ K$ and $1 \ atm$ pressure. What is the slope of the graph?
DifficultTS EAMCET 2024
View SolutionVedclass Products
For Students
Vedclass Test Series
Mock tests in real JEE/NEET style with performance analysis. 5-day free trial.
Start Free TrialFor Teachers
Exam Paper Generator
Generate Set A/B/C/D exam papers from 7.5L+ questions in 2 minutes. 3 chapters free.
Try FreeFor Institutes
Online Exam Module
Live online exams with unlimited students, 360° analytics & white-label branding.
See Demo