
The velocity $(v)-$ time $(t)$ plot of the motion of a body is shown below:
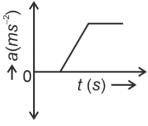
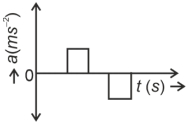
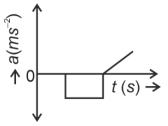
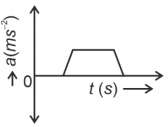
The acceleration $(a)-$ time $(t)$ graph that best suits this motion is:
The acceleration $(a)-$ time $(t)$ graph that best suits this motion is:
- A
- B
- C
- D
Explore More
Similar Questions
$A$ body is moving with variable acceleration $a$ along a straight line. The average acceleration of the body in the time interval $t_1$ to $t_2$ is
Medium
View SolutionThe displacement is given by $x = 2t^2 + t + 5$. The acceleration at $t = 2 \ s$ is:
The position,velocity,and acceleration of a particle moving with a constant acceleration can be represented by:
The acceleration versus time graph of a body starting from rest is shown in the figure. The velocity versus time graph of the body is given by:
Medium
View SolutionThe acceleration-time graph for a particle is given in the figure. If it starts motion at $t=0$, the distance travelled in $3 \, s$ will be ........... $m$.
Easy
View SolutionVedclass Products
For Students
Vedclass Test Series
Mock tests in real JEE/NEET style with performance analysis. 5-day free trial.
Start Free TrialFor Teachers
Exam Paper Generator
Generate Set A/B/C/D exam papers from 7.5L+ questions in 2 minutes. 3 chapters free.
Try FreeFor Institutes
Online Exam Module
Live online exams with unlimited students, 360° analytics & white-label branding.
See Demo