
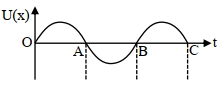
The variation of displacement with time of a particle executing free simple harmonic motion is shown in the figure. The potential energy $U(x)$ versus time $t$ plot of the particle is correctly shown in figure:
- A
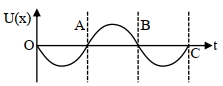
- B
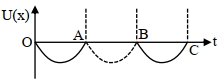
- C
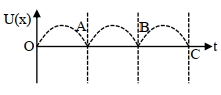
- D
Explore More
Similar Questions
$A$ particle starts oscillating simple harmonically from its mean position with time period $T$. At time $t=\frac{T}{12}$,the ratio of the potential energy to kinetic energy of the particle is $\left(\sin 30^{\circ}=\cos 60^{\circ}=0.5, \cos 30^{\circ}=\sin 60^{\circ}=\frac{\sqrt{3}}{2}\right)$
For a simple pendulum,a graph is plotted between its kinetic energy $(KE)$ and potential energy $(PE)$ against its displacement $d.$ Which one of the following represents these correctly? (graphs are schematic and not drawn to scale)
Medium
View SolutionThe displacements of two particles of same mass executing $SHM$ are represented by the equations $x_1=4 \sin \left(10 t+\frac{\pi}{6}\right)$ and $x_2=5 \cos (\omega t)$. The value of $\omega$ for which the energies of both the particles remain same is (in $\text{ unit}$)
For a particle executing $S.H.M.$,its potential energy is $8$ times its kinetic energy at a certain displacement $x$ from the mean position. If $A$ is the amplitude of $S.H.M.$,the value of $x$ is:
DifficultMHT CET 2023
View SolutionThe total energy of a simple harmonic oscillator is proportional to
Vedclass Products
For Students
Vedclass Test Series
Mock tests in real JEE/NEET style with performance analysis. 5-day free trial.
Start Free TrialFor Teachers
Exam Paper Generator
Generate Set A/B/C/D exam papers from 7.5L+ questions in 2 minutes. 3 chapters free.
Try FreeFor Institutes
Online Exam Module
Live online exams with unlimited students, 360° analytics & white-label branding.
See Demo