
The graph that does not represent the behaviour of an ideal gas is
- A
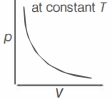
- B
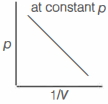
- C
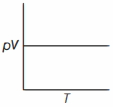
- D$B$ and $C$ both
Explore More
Similar Questions
Pressure of $1 \ g$ ideal gas $X$ at $300 \ K$ is $2 \ atm$. When $2 \ g$ of another gas $Y$ is introduced in the same vessel at the same temperature,the total pressure becomes $3 \ atm$. The correct relationship between molar masses of $X$ and $Y$ is:
Which graph is not a straight line for an ideal gas?
Easy
View Solution$A$ vessel contains $1.6 \ g$ of dioxygen at $STP$ ($273.15 \ K$,$1 \ atm$ pressure). The gas is now transferred to another vessel at constant temperature,where pressure becomes half of the original pressure. Calculate
$(A)$ volume of the new vessel.
$(B)$ number of molecules of dioxygen.
$(A)$ volume of the new vessel.
$(B)$ number of molecules of dioxygen.
Medium
View SolutionThe density of a gas at $-23 \ ^oC$ temperature and $780 \ \text{torr}$ pressure is $1.40 \ g/L$. Identify the gas.
Easy
View SolutionWhat is the density of $SO_2$ gas at $27\,^oC$ temperature and $2\, atm$ pressure in $g/L$? (Atomic weights: $S = 32, O = 16, R = 0.082\, L\, atm\, K^{-1}\, mol^{-1}$)
Medium
View SolutionVedclass Products
For Students
Vedclass Test Series
Mock tests in real JEE/NEET style with performance analysis. 5-day free trial.
Start Free TrialFor Teachers
Exam Paper Generator
Generate Set A/B/C/D exam papers from 7.5L+ questions in 2 minutes. 3 chapters free.
Try FreeFor Institutes
Online Exam Module
Live online exams with unlimited students, 360° analytics & white-label branding.
See Demo