
Class 12PhysicsDual Nature of Radiation and matterEinstein's Photoelectric Equation and Energy Quantum of Radiation
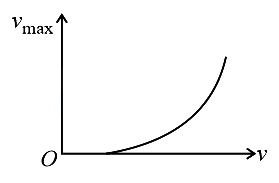
MediumThe graph between the maximum speed $v_{\text{max}}$ of a photoelectron and frequency $(\nu)$ of the incident radiation,in the photoelectric effect,is correctly represented by:
- A
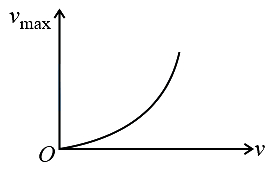
- B
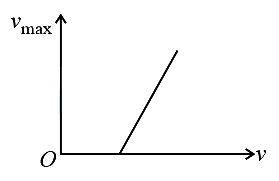
- C
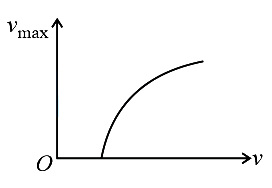
- D
Explore More
Similar Questions
The work function of a metal is $4.2 \ eV$. Its threshold wavelength will be .......... $ \mathring A $.
Easy
View SolutionTwo identical photocathodes receive light of frequencies $f_{1}$ and $f_{2}$ respectively. If the velocities of the photo-electrons emitted are $v_{1}$ and $v_{2}$ respectively,then:
Difficult
View SolutionWhen light of frequencies ${\nu _1}$ and ${\nu _2}$ $({\nu _1} > {\nu _2})$ is incident on a metal surface,the ratio of the maximum kinetic energy of the emitted photoelectrons is $1:k$. What is the threshold frequency of the metal?
Difficult
View SolutionThe slope of the graph between stopping potential and the frequency of incident radiation for the photoelectric effect is . . . . . . .
Medium
View SolutionPhotoelectric emission is observed from a metallic surface for frequencies ${\nu _1}$ and ${\nu _2}$ of the incident light rays $({\nu _1} > {\nu _2})$. If the maximum values of kinetic energy of the photoelectrons emitted in the two cases are in the ratio of $1:k$,then the threshold frequency of the metallic surface is
Medium
View SolutionVedclass Products
For Students
Vedclass Test Series
Mock tests in real JEE/NEET style with performance analysis. 5-day free trial.
Start Free TrialFor Teachers
Exam Paper Generator
Generate Set A/B/C/D exam papers from 7.5L+ questions in 2 minutes. 3 chapters free.
Try FreeFor Institutes
Online Exam Module
Live online exams with unlimited students, 360° analytics & white-label branding.
See Demo