
Class 11PhysicsKinetic Theory of GasesGas Laws (Charles, Boyle's, Avagadro's, Gay Lussacs and Dalton's law) and Ideal gas Equation
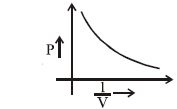
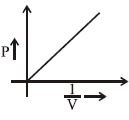
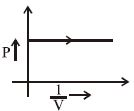
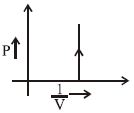
EasyFor an ideal gas undergoing a constant temperature process (isothermal process),what is the nature of the graph between pressure $(P)$ and $\frac{1}{V}$ (where $V$ is volume)?
- A
- B
- C
- D
Explore More
Similar Questions
In the given $(V - T)$ diagram,what is the relation between pressures $P_1$ and $P_2 \,?$
MediumAIPMT 2013
View SolutionWrite the values of standard temperature and pressure $(STP)$.
Difficult
View SolutionIf the pressure of an ideal gas contained in a closed vessel is increased by $0.5\%,$ the increase in temperature is $2 \, K.$ The initial temperature of the gas is ...... $^\circ C$
Medium
View Solution$A$ cylinder contains $10 \, kg$ of gas at a pressure of $10^7 \, N/m^2$. What amount of gas in $kg$ must be removed so that the final pressure becomes $2.5 \times 10^6 \, N/m^2$?
Medium
View SolutionThe $P-T$ graph shows a gas being heated. During this process from point $1$ to $2$,the volume of the gas:
Easy
View SolutionVedclass Products
For Students
Vedclass Test Series
Mock tests in real JEE/NEET style with performance analysis. 5-day free trial.
Start Free TrialFor Teachers
Exam Paper Generator
Generate Set A/B/C/D exam papers from 7.5L+ questions in 2 minutes. 3 chapters free.
Try FreeFor Institutes
Online Exam Module
Live online exams with unlimited students, 360° analytics & white-label branding.
See Demo