
Class 12PhysicsDual Nature of Radiation and matterPhotoelectric Effect by Lenard and it's Observations
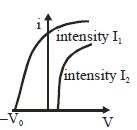
MediumThe curves $(1)$,$(2)$,$(3)$,and $(4)$ show the variation between the applied potential difference $(V)$ and the photoelectric current $(i)$ at two different intensities of light $(I_1 > I_2)$. In which figure is the correct variation shown?
- A
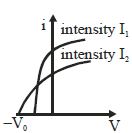
- B
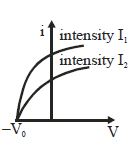
- C
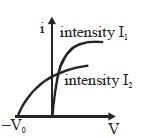
- D
Explore More
Similar Questions
The work functions of Caesium $(Cs)$, Potassium $(K)$, and Sodium $(Na)$ are $2.14\,eV$, $2.30\,eV$, and $2.75\,eV$ respectively. If incident electromagnetic radiation has an incident energy of $2.20\,eV$, which of these photosensitive surfaces may emit photoelectrons?
MediumNEET 2023
View SolutionAssertion : Photoelectric saturation current increases with the increase in frequency of incident light.
Reason : Energy of incident photons increases with increase in frequency and as a result photoelectric current increases.
Reason : Energy of incident photons increases with increase in frequency and as a result photoelectric current increases.
What is the photoelectric effect?
Medium
View SolutionThe curve between the work function of a metal $(\phi_o)$ and its temperature $(T)$ will be:
Medium
View SolutionConsider the two following statements $A$ and $B$, and identify the correct choice given in the answers :
$(A)$ In photovoltaic cells, the photoelectric current produced is not proportional to the intensity of incident light.
$(B)$ In gas-filled photoemissive cells, the velocity of photoelectrons depends on the wavelength of the incident radiation.
$(A)$ In photovoltaic cells, the photoelectric current produced is not proportional to the intensity of incident light.
$(B)$ In gas-filled photoemissive cells, the velocity of photoelectrons depends on the wavelength of the incident radiation.
Vedclass Products
For Students
Vedclass Test Series
Mock tests in real JEE/NEET style with performance analysis. 5-day free trial.
Start Free TrialFor Teachers
Exam Paper Generator
Generate Set A/B/C/D exam papers from 7.5L+ questions in 2 minutes. 3 chapters free.
Try FreeFor Institutes
Online Exam Module
Live online exams with unlimited students, 360° analytics & white-label branding.
See Demo