
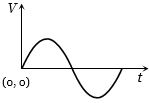
The current $i$ in an inductance coil varies with time $t$ according to the following graph. Which one of the following plots shows the variations of voltage $V$ in the coil?
- A
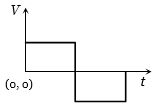
- B
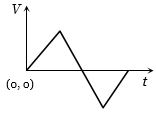
- C
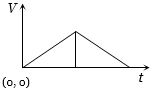
- D
Explore More
Similar Questions
$A$ flexible wire bent in the form of a circle is placed in a uniform magnetic field perpendicular to the plane of the coil. The radius of the coil changes as shown in the figure. The graph of induced $emf$ in the coil is represented by
Difficult
View SolutionTwo different coils have inductances $L_1 = 4 \ mH$ and $L_2 = 2 \ mH$. At a certain instant,the current in the two coils is increasing at the same constant rate,and the power supplied to the first coil is four times that of the second coil. If $e$,$I$,and $U$ indicate the potential difference,current,and energy stored in the inductance respectively,then which of the following is correct?
Difficult
View SolutionAn inductance of $2\,H$ carries a current of $2\,A$. To prevent sparking when the circuit is broken,a capacitor of $4\,\mu F$ is connected across the inductance. The voltage rating of the capacitor is of the order of
Medium
View SolutionWrite down the names of two devices which work on the principle of electromagnetic induction.
Easy
View SolutionThe current $i$ in an induction coil varies with time $t$ according to the graph shown in the figure. Which of the following graphs shows the induced emf $(E)$ in the coil with time?
Medium
View SolutionVedclass Products
For Students
Vedclass Test Series
Mock tests in real JEE/NEET style with performance analysis. 5-day free trial.
Start Free TrialFor Teachers
Exam Paper Generator
Generate Set A/B/C/D exam papers from 7.5L+ questions in 2 minutes. 3 chapters free.
Try FreeFor Institutes
Online Exam Module
Live online exams with unlimited students, 360° analytics & white-label branding.
See Demo