
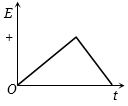
The current $I$ in an $A.C.$ circuit inductance coil varies with time according to the graph given below. Which one of the following graphs gives the variation of voltage with time?
- A
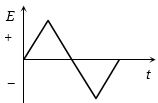
- B
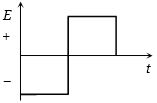
- C
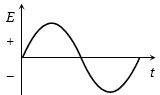
- D
Explore More
Similar Questions
In an $L-R$ circuit connected to a battery of constant $e.m.f.$ $E$,switch $S$ is closed at time $t = 0$. If $e$ denotes the magnitude of induced $e.m.f.$ across the inductor and $i$ the current in the circuit at any time $t$,then which of the following graphs shows the variation of $e$ with $i$?
Medium
View SolutionThe current through a coil varies according to the following graph. Plot the graph for induced $emf$ $(e)$ versus time $(t)$ for the coil.
Difficult
View Solution$A$ conducting loop having a capacitor is moving outward from the magnetic field. Which plate of the capacitor will be positive?
Easy
View SolutionAn electron moves along the line $AB$,which lies in the same plane as a circular loop of conducting wires as shown in the diagram. What will be the direction of current induced,if any,in the loop?
Difficult
View SolutionThe figure shows three circuits with identical batteries,inductors,and resistors. Rank the circuits according to the current through the battery $(i)$ just after the switch is closed and $(ii)$ a long time later,greatest first.
Difficult
View SolutionVedclass Products
For Students
Vedclass Test Series
Mock tests in real JEE/NEET style with performance analysis. 5-day free trial.
Start Free TrialFor Teachers
Exam Paper Generator
Generate Set A/B/C/D exam papers from 7.5L+ questions in 2 minutes. 3 chapters free.
Try FreeFor Institutes
Online Exam Module
Live online exams with unlimited students, 360° analytics & white-label branding.
See Demo