
Class 12PhysicsDual Nature of Radiation and matterPhotoelectric Effect by Lenard and it's Observations
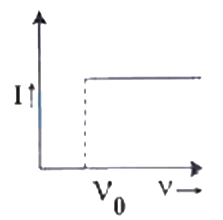
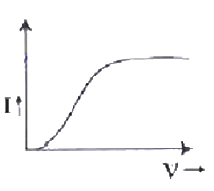
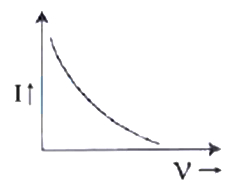
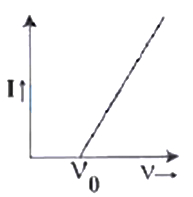
MediumThe anode voltage of a photocell is kept fixed. The frequency of the light falling on the cathode is gradually increased. Then the correct graph which shows the variation of photo current $I$ with the frequency $\nu$ of incident light is
- A
- B
- C
- D
Explore More
Similar Questions
In Lenard's experiment,what is the effect on the photoelectric current when ultraviolet radiation incident on the cathode is stopped?
Medium
View SolutionShow that wave theory cannot explain fundamental characteristics of photoelectric effect.
Medium
View SolutionPhoto cells convert
The number of photoelectrons emitted for light of frequency $v$ (higher than the threshold frequency $v_0$) is proportional to
When the intensity of incident light increases:
Vedclass Products
For Students
Vedclass Test Series
Mock tests in real JEE/NEET style with performance analysis. 5-day free trial.
Start Free TrialFor Teachers
Exam Paper Generator
Generate Set A/B/C/D exam papers from 7.5L+ questions in 2 minutes. 3 chapters free.
Try FreeFor Institutes
Online Exam Module
Live online exams with unlimited students, 360° analytics & white-label branding.
See Demo