
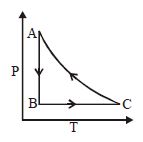
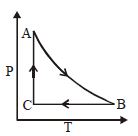
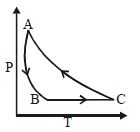
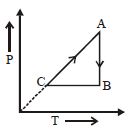
The adjoining figure shows the $P-V$ diagram for a fixed mass of an ideal gas undergoing a cyclic process. $AB$ represents an isothermal process and $CA$ represents an isochoric process. Which of the graphs shown in the following figures represents the $P-T$ diagram of the cyclic process?
- A
- B
- C
- D
Explore More
Similar Questions
The heat energy absorbed by a system in going through the cyclic process shown in the figure is:
An ideal monoatomic gas is taken round the cycle $12341$ shown in the figure ($p-V$ diagram). The work done in one cycle is (in $P_0V_0$)?
Medium
View SolutionIn the following figures,in which case is heat absorbed by the gas?
Medium
View Solution$A$ thermodynamic system is taken from an original state to an intermediate state by the linear process shown in the figure. Its volume is then reduced to the original value from $E$ to $F$ by an isobaric process. Calculate the total work done (in $J$) by the gas from $D$ to $E$ to $F$.
Medium
View SolutionThe pressure and volume of a gas are changed as shown in the $P-V$ diagram in this figure. The temperature of the gas will ........
Medium
View SolutionVedclass Products
For Students
Vedclass Test Series
Mock tests in real JEE/NEET style with performance analysis. 5-day free trial.
Start Free TrialFor Teachers
Exam Paper Generator
Generate Set A/B/C/D exam papers from 7.5L+ questions in 2 minutes. 3 chapters free.
Try FreeFor Institutes
Online Exam Module
Live online exams with unlimited students, 360° analytics & white-label branding.
See Demo