
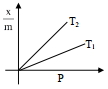
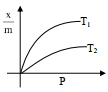
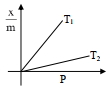
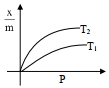
Select the graph that correctly describes the adsorption isotherms at two temperatures $T_{1}$ and $T_{2}$ $\left(T_{1}>T_{2}\right)$ for a gas :
($x-$ mass of the gas adsorbed ; $m-$ mass of adsorbent ; $P -$ pressure)
($x-$ mass of the gas adsorbed ; $m-$ mass of adsorbent ; $P -$ pressure)
- A
- B
- C
- D
Explore More
Similar Questions
When a graph is plotted between $\log (x/m)$ and $\log P$,it is a straight line with an angle of $45^o$ and an intercept of $0.3010$ on the $y-$axis. If the initial pressure is $0.3 \ atm$,what will be the amount of gas adsorbed per $g$ of adsorbent $(x/m)$?
Medium
View SolutionDuring the adsorption of krypton on activated charcoal at low temperature,
Which process occurs in chromatography?
Easy
View SolutionWhich graph represents the amount of chemisorption of a gas with temperature under constant pressure?
Easy
View Solution$A$ charcoal cube having side length $10 \ cm$ is chopped lengthwise into $5$ equal pieces. Then the effective adsorption power
Vedclass Products
For Students
Vedclass Test Series
Mock tests in real JEE/NEET style with performance analysis. 5-day free trial.
Start Free TrialFor Teachers
Exam Paper Generator
Generate Set A/B/C/D exam papers from 7.5L+ questions in 2 minutes. 3 chapters free.
Try FreeFor Institutes
Online Exam Module
Live online exams with unlimited students, 360° analytics & white-label branding.
See Demo