
Class 11Physics10-1.Thermometry, Thermal Expansion and CalorimetryMix Examples-Thermometry, Thermal Expansion and Calorimetry
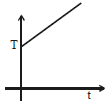
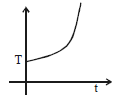
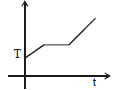
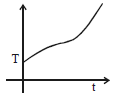
MediumIf liquefied oxygen at $1$ atmospheric pressure is heated from $50\, K$ to $300\, K$ by supplying heat at a constant rate,the graph of temperature vs. time will be:
- A
- B
- C
- D
Explore More
Similar Questions
$A$ glass flask of volume $1$ litre is fully filled with mercury at $0\,^{\circ}C$. Both the flask and mercury are now heated to $100\,^{\circ}C$. If the coefficient of volume expansion of mercury is $1.82 \times 10^{-4}/^{\circ}C$ and the coefficient of linear expansion of glass is $10 \times 10^{-6}/^{\circ}C$,the amount of mercury which is spilled out is ............ $ml$. (in $.2$)
Difficult
View SolutionWhat type of changes occur in an object by heating it?
Medium
View SolutionThe temperature of Bhakhra dam water at the ground level with respect to the temperature at a high level should be:
Easy
View Solution$A$ hailstone at $0^{\circ}C$ falls from a height of $1\, km$ on an insulating surface,converting the whole of its kinetic energy into heat. What part of it will melt? (Take $g = 10\, m/s^2$,$J = 4.2\, J/cal$,and latent heat of fusion of ice $L = 80\, cal/g = 80 \times 10^3\, cal/kg$)
Medium
View Solution$A$ $100 \, g$ of iron nail is hit by a $1.5 \, kg$ hammer striking at a velocity of $60 \, ms^{-1}$. What will be the rise in the temperature of the nail in $^{\circ}C$ if one-fourth of the energy of the hammer goes into heating the nail? [Specific heat capacity of iron $= 0.42 \, Jg^{-1} {}^{\circ}C^{-1}$]
Vedclass Products
For Students
Vedclass Test Series
Mock tests in real JEE/NEET style with performance analysis. 5-day free trial.
Start Free TrialFor Teachers
Exam Paper Generator
Generate Set A/B/C/D exam papers from 7.5L+ questions in 2 minutes. 3 chapters free.
Try FreeFor Institutes
Online Exam Module
Live online exams with unlimited students, 360° analytics & white-label branding.
See Demo