
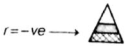
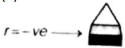
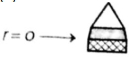
From the given graph of population growth,select the correct option that shows the correct value of '$r$' and the corresponding age pyramid.
- A

- B
- C
- D
Explore More
Similar Questions
Zero growth of population is indicated by
Medium
View SolutionGiven below are two statements.
Statement $I$: Under unlimited resource conditions,every species is capable of growing exponentially.
Statement $II$: $A$ population growing in a habitat with limited resources initially shows a very slow rate of growth.
In the light of the above statements,choose the correct option.
Statement $I$: Under unlimited resource conditions,every species is capable of growing exponentially.
Statement $II$: $A$ population growing in a habitat with limited resources initially shows a very slow rate of growth.
In the light of the above statements,choose the correct option.
Given below are two statements:
Statement-$I$: $A$ population growing in a habitat with limited resources shows initially a lag phase.
Statement-$II$: $A$ population growing in a habitat with limited resources shows finally an asymptote phase.
Statement-$I$: $A$ population growing in a habitat with limited resources shows initially a lag phase.
Statement-$II$: $A$ population growing in a habitat with limited resources shows finally an asymptote phase.
Medium
View SolutionThe formula $N_t = N_0 e^{rt}$ represents which type of growth?
Medium
View SolutionThe birth and death rates of four countries are given below. Which one will have the least population growth rate?
$Country$ $Birth\, rate$ $/1000$ $Death\, rate$ $/1000$ $M$ $15$ $5$ $N$ $25$ $10$ $O$ $35$ $18$ $P$ $48$ $41$
| $Country$ | $Birth\, rate$ $/1000$ | $Death\, rate$ $/1000$ |
| $M$ | $15$ | $5$ |
| $N$ | $25$ | $10$ |
| $O$ | $35$ | $18$ |
| $P$ | $48$ | $41$ |
Medium
View SolutionVedclass Products
For Students
Vedclass Test Series
Mock tests in real JEE/NEET style with performance analysis. 5-day free trial.
Start Free TrialFor Teachers
Exam Paper Generator
Generate Set A/B/C/D exam papers from 7.5L+ questions in 2 minutes. 3 chapters free.
Try FreeFor Institutes
Online Exam Module
Live online exams with unlimited students, 360° analytics & white-label branding.
See Demo