
Medium
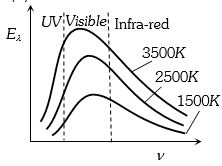
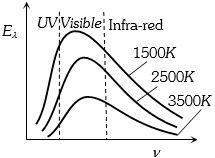
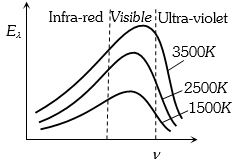
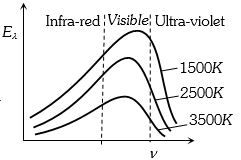
The following graph shows the correct variation in the intensity of heat radiations emitted by a black body with respect to frequency at different fixed temperatures. Identify the correct graph.
- A
- B
- C
- D
Explore More
Similar Questions
Inside a closed furnace held at a temperature of $400\, K,$ we have a black body. $A$ hole of area $10\, cm^2$ is opened in the furnace so that sunlight starts falling on the black body. The intensity of sunlight is $2000\, W/m^2.$ In the steady state:
Medium
View SolutionThe intensity of direct sunlight on a surface normal to the rays is $I_0$. What is the intensity of direct sunlight on a surface,whose normal makes an angle of $60^{\circ}$ with the rays of the sun?
Easy
View SolutionWhich of the following statements does not hold good for thermal radiation?
MediumKCET 2009
View SolutionTwo identical objects $A$ and $B$ are at temperatures $T_A$ and $T_B$ respectively. Both objects are placed in a room with perfectly absorbing walls maintained at temperature $T$ $(T_A > T > T_B)$. The objects $A$ and $B$ attain temperature $T$ eventually. Which one of the following is the correct statement?
Medium
View SolutionIf $e_\lambda$ and $a_\lambda$ are the emissive power and absorptive power of a body respectively,and $E_\lambda$ is the emissive power of a perfectly black body,what is the relation according to Kirchhoff's law?
Easy
View SolutionVedclass Products
For Students
Vedclass Test Series
Mock tests in real JEE/NEET style with performance analysis. 5-day free trial.
Start Free TrialFor Teachers
Exam Paper Generator
Generate Set A/B/C/D exam papers from 7.5L+ questions in 2 minutes. 3 chapters free.
Try FreeFor Institutes
Online Exam Module
Live online exams with unlimited students, 360° analytics & white-label branding.
See Demo