
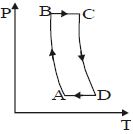
The density $\rho$ versus volume $V$ graph is shown in the figure. Find the corresponding pressure $P$ versus temperature $T$ graph.
- A
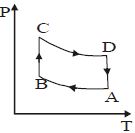
- B
- C
- D
Explore More
Similar Questions
The pressure of a gas changes linearly with volume from $A$ to $B$ as shown in the figure. If no heat is supplied to or extracted from the gas,then the change in the internal energy of the gas will be $............\,J$.
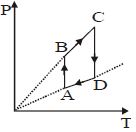
$A$ cyclic process $ABCA$ is shown in the $T-V$ diagram. An ideal gas of $2 \text{ mole}$ undergoes this process. $A$ total of $1200 \text{ J}$ of heat is rejected by the gas in the complete cycle. Find the work done by the gas during the process $BC$. (in $\text{ J}$)
Medium
View SolutionAs shown in the figure,the amount of heat absorbed along the path $ABC$ is $90\,J$ and the amount of work done by the system is $30\,J$. If the amount of work done along the path $ADC$ is $20\,J$,the amount of heat absorbed will be .... $J$.
Medium
View SolutionThe pressure $(P)$ versus density $(d)$ graph of an ideal gas is shown in the figure. Choose the correct statement.
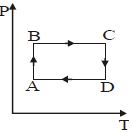
$A$ thermodynamic system undergoes a cyclic process $ABCDA$ as shown in the figure. The work done by the system in the cycle is
MediumAIPMT 2014
View SolutionVedclass Products
For Students
Vedclass Test Series
Mock tests in real JEE/NEET style with performance analysis. 5-day free trial.
Start Free TrialFor Teachers
Exam Paper Generator
Generate Set A/B/C/D exam papers from 7.5L+ questions in 2 minutes. 3 chapters free.
Try FreeFor Institutes
Online Exam Module
Live online exams with unlimited students, 360° analytics & white-label branding.
See Demo