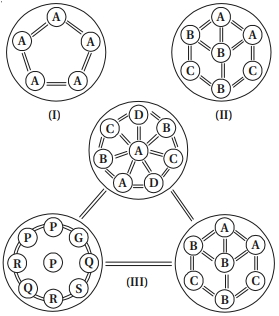
Comment on the following figures : $\rm {I,\,II}$ and $\rm {III}$ : $\rm {A, \,B, \,C, \,D, \,G, \,P, \,Q, \,R,\,S}$ are species

Comment on the following figures : $\rm {I,\,II}$ and $\rm {III}$ : $\rm {A, \,B, \,C, \,D, \,G, \,P, \,Q, \,R,\,S}$ are species

Fig.$I$ : It is a single population and all individuals are of the same species, i.e. $A$ - Individual interact among themselves and their environment - Intraspecific interaction.
Fig. $II$ : It is a community and it contains three populations of species $A$, $B$ and $C$. They interact with each other and their environment - Interspecific interaction.
Fig. $III$ : It is a biome. It contains three communities of which one is in climax and other two are in different stages of development. All three communities are in the same environment and they interact with each other and their environment.
Similar Questions
The species of plants that play a vital role in controlling the relative abundance of other species in a community are called
The species of plants that play a vital role in controlling the relative abundance of other species in a community are called
Ozone hole means
Ozone hole means
Maximum contribution of $O_2$ is from
Maximum contribution of $O_2$ is from
- [AIPMT 1989]
Gloger's rule related to the
Gloger's rule related to the
The closely related morphologically similar sympatric populations, but reproductively isolated, are designated as
The closely related morphologically similar sympatric populations, but reproductively isolated, are designated as


