
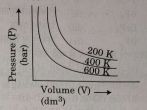
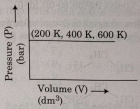
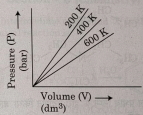
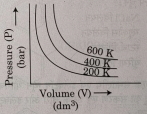
Choose the correct option for the graphical representation of Boyle's law,which shows a graph of pressure vs. volume of a gas at different temperatures:
- A
- B
- C
- D
Explore More
Similar Questions
The value of the gas constant $R$ depends on which of the following?
Easy
View Solution$A$ certain mass of a gas occupies a volume of $2 \ dm^{3}$ at $STP$. At what temperature will the volume of the gas become double,keeping the pressure constant (in $^{\circ} C$)?
If the density of dioxygen gas at $STP$ is $1.43 \, g \, L^{-1}$,calculate its density at $17 \, ^\circ C$ and $800 \, torr$ pressure.
Medium
View Solution$300 \ mL$ of a gas at $27 \ ^\circ C$ is cooled to $-3 \ ^\circ C$ at constant pressure. The final volume is ................ $mL$.
Medium
View SolutionWhich of the following represents the correct relationship between the change in density of an ideal gas and the change in temperature?
Medium
View SolutionVedclass Products
For Students
Vedclass Test Series
Mock tests in real JEE/NEET style with performance analysis. 5-day free trial.
Start Free TrialFor Teachers
Exam Paper Generator
Generate Set A/B/C/D exam papers from 7.5L+ questions in 2 minutes. 3 chapters free.
Try FreeFor Institutes
Online Exam Module
Live online exams with unlimited students, 360° analytics & white-label branding.
See Demo