
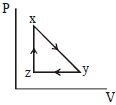
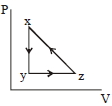
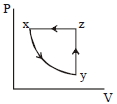
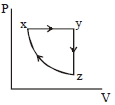
$A$ thermodynamic cycle $xyzx$ is shown on a $V-T$ diagram.
The $P-V$ diagram that best describes this cycle is
(Diagrams are schematic and not to scale)
The $P-V$ diagram that best describes this cycle is
(Diagrams are schematic and not to scale)
- A
- B
- C
- D
Explore More
Similar Questions
An ideal gas is taken through the cycle $A \to B \to C \to A,$ as shown in the figure. What is the change in internal energy in $J$?
Easy
View Solution$n$ moles of an ideal gas undergo a process $A \to B$ as shown in the figure. The maximum temperature of the gas during the process is
DifficultJEE MAIN 2016
View SolutionOne mole of an ideal monoatomic gas is taken along the path $ABCA$ as shown in the $PV$ diagram. The maximum temperature attained by the gas along the path $BC$ is given by
DifficultJEE MAIN 2018
View Solution$A$ cyclic process $ABCD$ is shown below in the given $P-V$ diagram. Which of the following diagrams represents the same process in a $P-T$ diagram?
$A$ constant amount of an ideal gas undergoes the cyclic process $ABCA$ in the $p-V$ graph shown below. The path $BC$ is an isothermal process. The work done by the gas during one complete cycle,beginning and ending at $A$,is nearly .......... $kJ$.
DifficultKVPY 2011
View SolutionVedclass Products
For Students
Vedclass Test Series
Mock tests in real JEE/NEET style with performance analysis. 5-day free trial.
Start Free TrialFor Teachers
Exam Paper Generator
Generate Set A/B/C/D exam papers from 7.5L+ questions in 2 minutes. 3 chapters free.
Try FreeFor Institutes
Online Exam Module
Live online exams with unlimited students, 360° analytics & white-label branding.
See Demo