
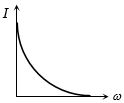
$A$ constant voltage at different frequencies is applied across a capacitance $C$ as shown in the figure. Which of the following graphs correctly depicts the variation of current with frequency?
- A
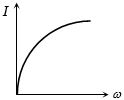
- B
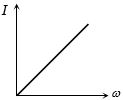
- C
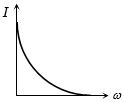
- D
Explore More
Similar Questions
The inductive reactance of a coil is $R$. If the inductance of the coil is doubled and the frequency of the $A.C.$ supply is also doubled,then the new inductive reactance will be:
Same current is flowing in two different $A.C.$ circuits. The first circuit contains only an inductance $(L)$ and the second contains only a capacitance $(C)$. If the frequency of the $A.C.$ source is increased in both circuits, what will happen to the current?
Explain the dissipation of electrical energy when an alternating current passes through a resistor.
Difficult
View SolutionIn a circuit,the current lags behind the voltage by a phase difference of $\pi / 2$. The circuit will contain which of the following?
MediumAIIMS 2001
View SolutionThe graphs given below depict the dependence of two reactive impedances $X_1$ and $X_2$ on the frequency of the alternating e.m.f. applied individually to them. We can then say that
Medium
View SolutionVedclass Products
For Students
Vedclass Test Series
Mock tests in real JEE/NEET style with performance analysis. 5-day free trial.
Start Free TrialFor Teachers
Exam Paper Generator
Generate Set A/B/C/D exam papers from 7.5L+ questions in 2 minutes. 3 chapters free.
Try FreeFor Institutes
Online Exam Module
Live online exams with unlimited students, 360° analytics & white-label branding.
See Demo