
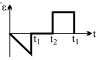
$A$ wire loop is placed in a region of time-varying magnetic field which is oriented orthogonally to the plane of the loop as shown in the figure. The graph shows the magnetic field variation as a function of time. Assume the positive $emf$ is the one which drives a current in the clockwise direction as seen by the observer in the direction of $B$. Which of the following graphs best represents the induced $emf$ as a function of time?
- A
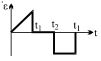
- B
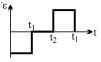
- C
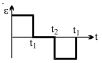
- D
Explore More
Similar Questions
$A$ square metal loop of side $10 \, cm$ and resistance $1 \, \Omega$ is moved with a constant velocity partly inside a magnetic field of $2 \, Wb \cdot m^{-2}$,directed into the paper,as shown in the figure. This loop is connected to a network of five resistors each of value $3 \, \Omega$. If a steady current of $1 \, mA$ flows in the loop,then the speed of the loop is ..... $cm \cdot s^{-1}$.
Difficult
View Solution$A$ coil and a bulb are connected in series with a $DC$ source. $A$ soft iron core is then inserted into the coil. What happens to the intensity of the bulb?
Easy
View SolutionTwo circular coils $P$ and $Q$ are fixed coaxially and carry currents $I_1$ and $I_2$ respectively.
Medium
View SolutionThe network shown in the figure is a part of a complete circuit. If at a certain instant the current $i$ is $5 \, A$ and is decreasing at the rate of $10^3 \, A/s$,then $V_A - V_B$ is......$V$.
Difficult
View SolutionOn what factor does the induced current depend?
Medium
View SolutionVedclass Products
For Students
Vedclass Test Series
Mock tests in real JEE/NEET style with performance analysis. 5-day free trial.
Start Free TrialFor Teachers
Exam Paper Generator
Generate Set A/B/C/D exam papers from 7.5L+ questions in 2 minutes. 3 chapters free.
Try FreeFor Institutes
Online Exam Module
Live online exams with unlimited students, 360° analytics & white-label branding.
See Demo