
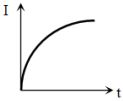
The variation of current flowing through an electric heater with time,when it is switched on,is shown in the figure. Considering the change in resistance with temperature,which of the following graphs is correct?
- A
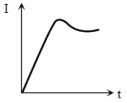
- B
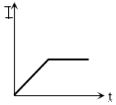
- C
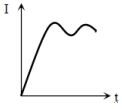
- D
Explore More
Similar Questions
The ends of an element of zinc wire are kept at a small temperature difference $\Delta T$ and a small current $I$ is passed through the wire. Then, the heat developed per unit time
$A$ battery is charged by a $15\,V$ battery for $8\,h$ at a current of $10\,A$. When this battery discharges, it provides a current of $5\,A$ for $15\,h$. The average terminal voltage during discharge is $14\,V$. What is the $watt-hour$ efficiency of this battery in $\%$?
Difficult
View Solution$A$ thermocouple is made from two metals,Antimony and Bismuth. If one junction of the couple is kept hot and the other is kept cold,then,an electric current will
MediumAIEEE 2006
View Solution$A$ student measures the terminal potential difference $(V)$ of a cell (of $emf \; \varepsilon$ and internal resistance $r$) as a function of the current $(I)$ flowing through it. The slope and intercept of the graph between $V$ and $I$,respectively,are equal to:
The bulb which glows with maximum intensity in the given circuit is
Vedclass Products
For Students
Vedclass Test Series
Mock tests in real JEE/NEET style with performance analysis. 5-day free trial.
Start Free TrialFor Teachers
Exam Paper Generator
Generate Set A/B/C/D exam papers from 7.5L+ questions in 2 minutes. 3 chapters free.
Try FreeFor Institutes
Online Exam Module
Live online exams with unlimited students, 360° analytics & white-label branding.
See Demo