
Which of the following graphs represents a first-order reaction?
- A
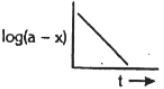
- B
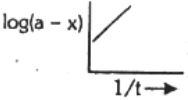
- C
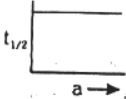
- DBoth $A$ and $C$.
Explore More
Similar Questions
What is the half-life of a first-order reaction if the time required to decrease the concentration of the reactant from $0.8 \ mol \ dm^{-3}$ to $0.2 \ mol \ dm^{-3}$ is $12 \ hour$ (in $hour$)?
The reaction $2N_2O_5 \,(g) \to 4NO_2 \,(g) + O_2 \,(g)$ follows first order kinetics. The pressure of a vessel containing only $N_2O_5$ was found to increase from $50 \, mmHg$ to $87.5 \, mmHg$ in $30 \, min$. The pressure exerted by the gases after $60 \, min$ will be .......... $mmHg$ (assume temperature remains constant).
The first order rate constant for the decomposition of $N_2O_5$ is $6.2 \times 10^{-4} \ s^{-1}$. The half-life period for this decomposition in seconds is:
Easy
View SolutionFor two first-order reactions:
$A \rightarrow \text{Products}$
$B \rightarrow \text{Products}$
If at the same time,$50\% \, B$ has reacted and $94\% \, A$ has reacted,calculate the ratio $K_1/K_2$.
$A \rightarrow \text{Products}$
$B \rightarrow \text{Products}$
If at the same time,$50\% \, B$ has reacted and $94\% \, A$ has reacted,calculate the ratio $K_1/K_2$.
Medium
View SolutionThe half-life period of a first-order reaction is given by:
Easy
View SolutionVedclass Products
For Students
Vedclass Test Series
Mock tests in real JEE/NEET style with performance analysis. 5-day free trial.
Start Free TrialFor Teachers
Exam Paper Generator
Generate Set A/B/C/D exam papers from 7.5L+ questions in 2 minutes. 3 chapters free.
Try FreeFor Institutes
Online Exam Module
Live online exams with unlimited students, 360° analytics & white-label branding.
See Demo