
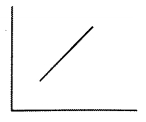
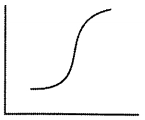
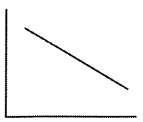
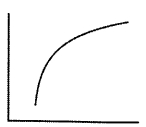
In the equation $S = CA^z$,where $S =$ species richness,$A =$ area,$Z =$ slope of the line,and $C =$ $Y$-intercept. If area is on the $X$-axis and species richness is on the $Y$-axis,what will the graph of $S = CA^z$ look like?
- A
- B
- C
- D
Explore More
Similar Questions
Match the following based on the biodiversity of the Amazon rainforest:
Column-$I$ Column-$II$ $(P)$ Plants $(I)$ $40,000$ $(Q)$ Fishes $(II)$ $3,000$ $(R)$ Birds $(III)$ $1,300$ $(S)$ Mammals or Amphibians $(IV)$ $427$ $(T)$ Reptiles $(V)$ $378$
| Column-$I$ | Column-$II$ |
| $(P)$ Plants | $(I)$ $40,000$ |
| $(Q)$ Fishes | $(II)$ $3,000$ |
| $(R)$ Birds | $(III)$ $1,300$ |
| $(S)$ Mammals or Amphibians | $(IV)$ $427$ |
| $(T)$ Reptiles | $(V)$ $378$ |
Medium
View SolutionEndemic species are those that are........
Easy
View SolutionIn which regions does the plant $Rauwolfia \text{ vomitoria}$ show genetic diversity?
Medium
View SolutionState the contribution of the following scientists:
$(i)$ Edward Wilson
$(ii)$ Robert May
$(i)$ Edward Wilson
$(ii)$ Robert May
Easy
View SolutionIdentify the incorrect statement from the following.
Medium
View SolutionVedclass Products
For Students
Vedclass Test Series
Mock tests in real JEE/NEET style with performance analysis. 5-day free trial.
Start Free TrialFor Teachers
Exam Paper Generator
Generate Set A/B/C/D exam papers from 7.5L+ questions in 2 minutes. 3 chapters free.
Try FreeFor Institutes
Online Exam Module
Live online exams with unlimited students, 360° analytics & white-label branding.
See Demo