
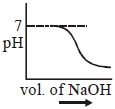
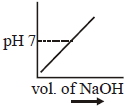
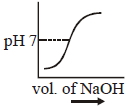
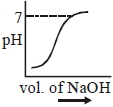
$100 \ mL$ of $0.1 \ M$ $HCl$ is taken in a beaker and to it $100 \ mL$ of $0.1 \ M$ $NaOH$ is added in steps of $2 \ mL$ and the $pH$ is continuously measured. Which of the following graphs correctly depicts the change in $pH$?
- A
- B
- C
- D
Explore More
Similar Questions
The $pH$ of a $10^{-8} \ M \ HCl$ aqueous solution is ......
Difficult
View SolutionMillimoles of calcium hydroxide required to produce $100 \ mL$ of the aqueous solution of $pH$ $12$ is $x \times 10^{-1}$. The value of $x$ is $..............$. (Nearest integer). Assume complete dissociation.
DifficultJEE MAIN 2023
View SolutionHow many liters of water must be added to $1 \ L$ of an aqueous $HCl$ solution with $pH = 1$ to make the $pH$ of the resulting solution equal to $2$ (in $L$)?
Medium
View SolutionWhat is the $pH$ of a solution obtained by dissolving $0.2 \, g$ of $NaOH$ in $100 \, mL$ of water (in $.699$)?
Medium
View SolutionThe ratio of $pH$ of $0.1 \, M \, H_2SO_4$ and that of $0.1 \, N \, H_2SO_4$ is
Medium
View SolutionVedclass Products
For Students
Vedclass Test Series
Mock tests in real JEE/NEET style with performance analysis. 5-day free trial.
Start Free TrialFor Teachers
Exam Paper Generator
Generate Set A/B/C/D exam papers from 7.5L+ questions in 2 minutes. 3 chapters free.
Try FreeFor Institutes
Online Exam Module
Live online exams with unlimited students, 360° analytics & white-label branding.
See Demo