
Difficult
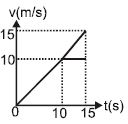
$A$ particle starts from rest and undergoes an acceleration as shown in the figure. The velocity-time graph from the figure will have which shape?
- A
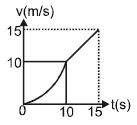
- B
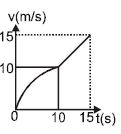
- C
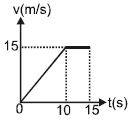
- D
Explore More
Similar Questions
What is the maximum acceleration of the train during the journey in $km \ h^{-2}$?
Difficult
View SolutionGiven below are two statements:
Statement $I:$ Area under velocity-time graph gives the displacement of the body in a given time.
Statement $II:$ Area under acceleration-time graph is equal to the change in velocity in the given time.
In the light of given statements,choose the correct answer from the options given below.
Statement $I:$ Area under velocity-time graph gives the displacement of the body in a given time.
Statement $II:$ Area under acceleration-time graph is equal to the change in velocity in the given time.
In the light of given statements,choose the correct answer from the options given below.
The following plots show the variation of velocity $(v)$ with time $(t)$ for a ball thrown vertically upward and falling back. Which of the following plots is correct?
MediumNEET 2026
View SolutionThe figure shows a velocity-time graph of a particle moving along a straight line. The particle comes to rest at $t = \dots \text{sec}$.
Easy
View Solution$A$ train moves from one station to another in $2$ hours. Its speed-time graph during this motion is shown in the figure. The maximum acceleration during the journey is ............. $km\, h^{-2}$.
Easy
View SolutionVedclass Products
For Students
Vedclass Test Series
Mock tests in real JEE/NEET style with performance analysis. 5-day free trial.
Start Free TrialFor Teachers
Exam Paper Generator
Generate Set A/B/C/D exam papers from 7.5L+ questions in 2 minutes. 3 chapters free.
Try FreeFor Institutes
Online Exam Module
Live online exams with unlimited students, 360° analytics & white-label branding.
See Demo